
You tap a menu button on a WordPress site and nothing happens for a moment. You tap again. Then the menu opens, closes, and opens once more. Nothing is technically broken, yet the page feels unreliable. That small delay is exactly what Google's Interaction to Next Paint metric, usually shortened to INP, is designed to capture.
INP became an official Core Web Vitals metric in March 2024, replacing First Input Delay. Older speed metrics mostly describe how quickly a page first appears. INP asks a different question: when a visitor clicks, taps, or presses a key, how long does the page take to visibly respond?
This guide explains INP in plain language, shows you how to measure it properly, and walks through fixes that suit typical WordPress sites, including those that use page builders, ad scripts, and plenty of plugins. We cannot promise any ranking change, because speed is only one of many signals. What you can expect is a page that feels more responsive to real people, which is the reason the metric exists.
What Is INP and Why It Matters
Interaction to Next Paint measures how quickly a page responds to user input throughout a visit. Every click, tap, or key press is observed. The page's INP is based on one of the slowest interactions, so a single sluggish button can drag the score down even if everything else feels fast.
Responsiveness matters because visitors judge a site by how it feels, not by a number. A search box that lags, an accordion that stutters, or a "Add comment" button that seems dead all create friction. For a content site, that friction can mean readers leave sooner and engage less.
The Three Parts of an Interaction
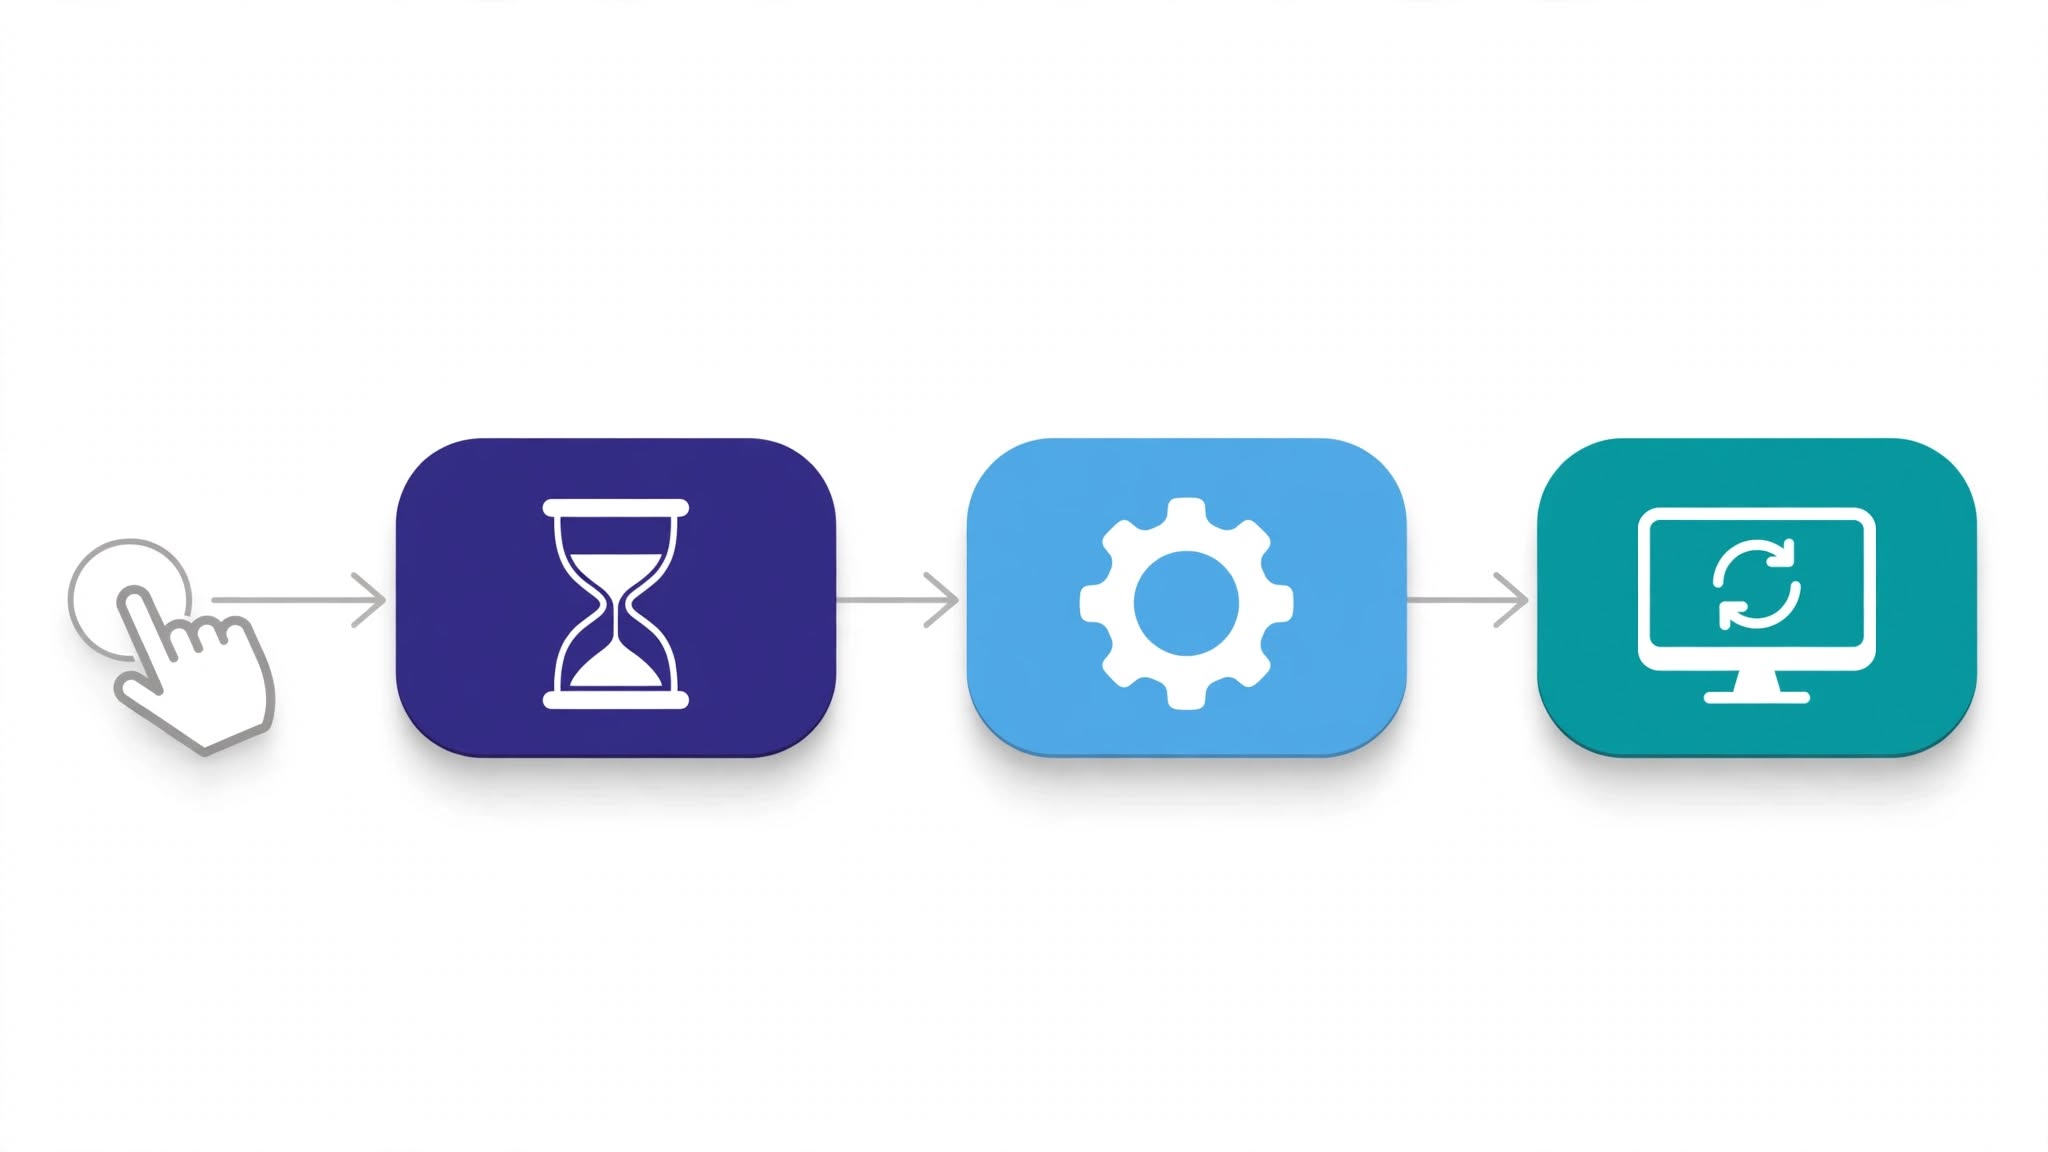
Knowing where the time goes tells you which fix to try first.
- Input delay: the wait before the browser can start handling your click, usually because the main thread is busy running other JavaScript.
- Processing time: the time your event handlers take to run, for example a script that opens a menu or filters a list.
- Presentation delay: the time the browser needs to recalculate layout, repaint, and show the result on screen. A large, complicated page makes this slower.
INP Score Thresholds
Google publishes three ranges for INP. The result is evaluated at the 75th percentile of real page visits, meaning at least three out of four visits should fall within the range you are aiming for.
| Rating | INP value | What it means |
|---|---|---|
| Good | 200 ms or less | Interactions feel immediate for most visitors. |
| Needs improvement | Over 200 ms up to 500 ms | Noticeable lag on some interactions. |
| Poor | Over 500 ms | Visitors are likely to feel the page is slow to respond. |
INP vs FID: First Input Delay only measured the delay before the first interaction began processing. INP looks at interactions across the whole visit and includes processing and painting, so it is a stricter and more realistic test.
How to Measure INP on Your WordPress Site
The most common mistake is trusting a single lab score. INP is fundamentally a field metric: it depends on what real visitors do on real devices. Start with real data, then reproduce problems yourself.
Start With Field Data
Open PageSpeed Insights and test a few important URLs, such as your homepage, a popular post, and a page with ads or forms. If your site has enough traffic, the "Discover what your real users are experiencing" section shows INP from real Chrome users. The Core Web Vitals report in Google Search Console groups URLs with similar problems, which saves time on larger sites.
Low-traffic sites may show no field data at all. That does not mean everything is fine. It means you will rely more on your own testing.
Reproduce the Problem in Chrome DevTools
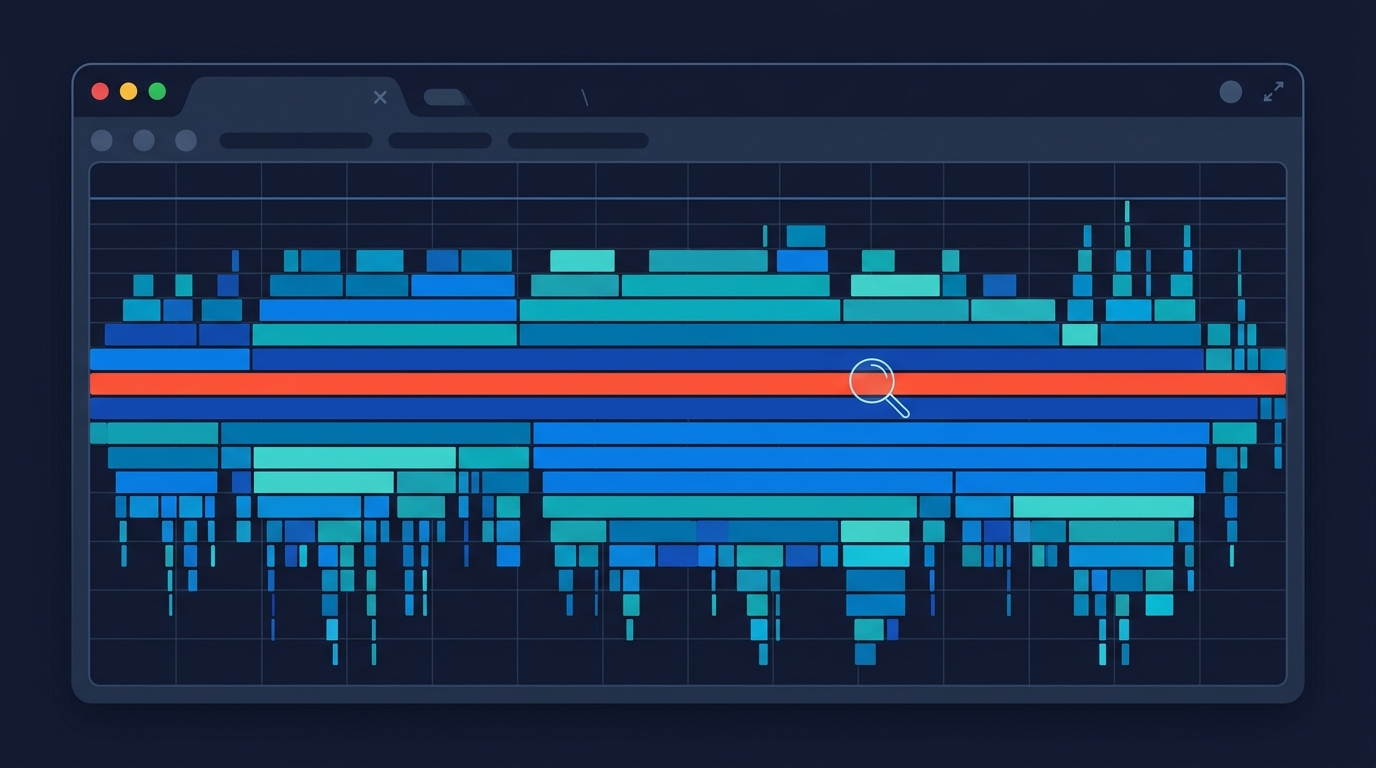
- Open the slow page in Chrome and press F12 to open DevTools.
- Go to the Performance tab and enable CPU throttling (for example 4x slowdown) to imitate a mid-range phone.
- Click Record, perform the interaction you suspect (open the menu, use the search box), then stop recording.
- Look at the Interactions track and at long tasks, which are marked with a red corner. Any task longer than 50 milliseconds can delay a response.
- Click the task and check which script, plugin file, or function is responsible.
Use Lab Metrics as Clues
Total Blocking Time (TBT) in lab tests is not INP, but it points in the same direction. A high TBT usually means long JavaScript tasks, which is a useful hint when you have no field data. Treat it as a clue rather than a verdict.
Common Causes of Poor INP on WordPress
WordPress itself is rarely the problem. The slowdown usually comes from what is layered on top of it.
| Cause | Typical symptom | Where to look first |
|---|---|---|
| Too many plugins loading scripts on every page | Menu or buttons respond late | Plugin list, Network tab |
| Third-party scripts (ads, chat, tracking, widgets) | Lag while the page is still loading | Tag manager, ad code, embeds |
| Heavy page builder output | Slow to paint after a click | Page DOM size, nested sections |
| Large JavaScript bundles | Long tasks in the performance trace | Theme and plugin script files |
| Expensive custom event handlers | One specific button is slow | Your own or a plugin's JS |
| Slow phones and shared hosting load | Fine on desktop, poor on mobile | Test with CPU throttling |
Step-by-Step: How to Improve INP in WordPress
Work through these steps in order and retest after each major change. Always make a full backup first, and try changes on a staging copy when possible.
Step 1: Record a Baseline and Find the Worst Interaction
Write down your current INP from PageSpeed Insights or Search Console, plus the exact interaction that feels slowest. Without a baseline you cannot tell whether a change helped or whether you simply got a lucky test run.
Step 2: Audit Plugins and Remove What You Do Not Need
Deactivate plugins one at a time on a staging site and repeat your slow interaction. A free tool such as Query Monitor can show which plugins add scripts and styles. Be especially careful with sliders, pop-up builders, social feeds, and all-in-one "feature" plugins that load code everywhere even when a page uses none of it. Replacing a heavy plugin with a lighter one, or with a few lines of theme code, often helps more than any tuning.
Step 3: Take Control of Third-Party Scripts
Third-party code runs on the same main thread as your own, so it competes with your visitor's click. List every external script on your key pages: analytics, ad code, chat widgets, embedded videos, review badges. For each one, ask whether it earns its place.
- Remove tags you no longer use from your tag manager.
- Load chat widgets or social embeds only after interaction, or only on pages where they matter.
- Replace video embeds with a click-to-load preview image.
- If you run ads, follow the ad provider's placement guidance and avoid stacking many ad units high on the page. Do not alter or block ad code in ways that break the provider's policies.
Step 4: Reduce and Defer JavaScript Carefully
Less JavaScript means fewer long tasks. Most performance and caching plugins offer options to defer scripts, minify files, or delay execution until the first interaction. These can help, but they can also break menus, forms, and checkout flows. Enable one option at a time, then test your key interactions on desktop and mobile after each change.
Be careful with "delay all JavaScript": It can make the first load look faster while pushing the work to the first tap, which may make that first interaction slower. Test the actual interaction, not only the loading score.
Step 5: Simplify the Page Structure
A large DOM makes every style recalculation and repaint more expensive, which increases presentation delay. Page builders can generate many nested wrappers. Look for sections with unnecessary columns, hidden mobile-only duplicates, and long pages with hundreds of repeated cards. Splitting very long pages, using simpler layouts, or paginating archives can reduce the work the browser performs after each click.
For long article pages or lists that sit far below the fold, the CSS property content-visibility: auto lets the browser skip rendering work until those sections approach the screen. It suits independent blocks, so test it before rolling it out widely.
Step 6: Break Up Long Tasks in Custom Code
If you or a developer maintain custom JavaScript, split heavy work into smaller chunks and give the browser a chance to respond to input between them. A common pattern is to yield back to the main thread:
function yieldToMain() {
  if ('scheduler' in window && 'yield' in scheduler) {
    return scheduler.yield();
  }
  return new Promise(resolve => setTimeout(resolve, 0));
}
async function processItems(items) {
  for (const item of items) {
    handleItem(item);       // your own work
    await yieldToMain();    // let the browser handle input
  }
}
The fallback uses setTimeout for browsers without scheduler.yield(). For very long lists you can yield every few items instead of every item, which keeps overhead low.
Step 7: Give Instant Visual Feedback
INP ends at the next paint. If a button triggers a slow operation, update something small first, such as a pressed state or a spinner, then do the heavy work afterward. The visitor sees an immediate response, and the browser is free to paint sooner. Doing the visual update before expensive logic is one of the simplest improvements for forms, filters, and "load more" buttons.
Step 8: Retest and Wait for Field Data
Lab tests confirm that a fix works locally. Field data in PageSpeed Insights and Search Console is collected over a rolling period, so improvements show up gradually. Do not panic if the number does not change the next day. Keep your baseline notes and compare after a few weeks of normal traffic.
Pros and Cons of Delaying JavaScript
Delaying or deferring scripts is popular advice, so it deserves a balanced look.
Advantages
- Frees the main thread during initial load
- Can reduce Total Blocking Time
- Often available as a simple plugin setting
- Works well for non-essential scripts such as chat widgets
Disadvantages
- May break menus, sliders, forms, or ads
- Can push work to the first tap, hurting that interaction
- Needs testing across devices after every change
- Hides problems rather than removing heavy code
Common Mistakes and How to Avoid Them
- Chasing a perfect lab score. A green lab score does not guarantee good field INP. Check real-user data.
- Testing only on a fast laptop. Use CPU throttling or a real mid-range phone.
- Installing several optimization plugins at once. They can conflict, and you will not know which one helped or broke something.
- Ignoring one slow button. INP reflects slow interactions, so a single heavy handler can set your score.
- Skipping backups and staging. Script changes can break layouts or ads in ways that are easy to miss.
- Removing ad or analytics code carelessly. Keep revenue and tracking intact, and change one thing at a time.
Quick Checklist
- Record current INP and the slowest interaction.
- Test with CPU throttling in Chrome DevTools.
- Remove or replace heavy plugins.
- Trim or delay non-essential third-party scripts.
- Defer scripts one option at a time, testing after each.
- Reduce DOM size and heavy page-builder layouts.
- Break up long tasks in custom code.
- Show instant visual feedback before slow work.
- Recheck field data after a few weeks.
If your theme is part of the problem, consider moving to a lightweight WordPress theme. Server resources matter too, so it is worth reviewing your hosting plan if slowness appears even on simple pages. And because images often dominate page weight, remember to optimize your images alongside the script fixes described above.
For deeper technical background, Google's own documentation on Interaction to Next Paint and how to optimize INP is a reliable reference.
Frequently Asked Questions
What is a good INP score?
Google considers 200 milliseconds or less good, 200 to 500 milliseconds as needing improvement, and over 500 milliseconds as poor, measured at the 75th percentile of real visits.
Does INP affect SEO?
INP is part of Core Web Vitals, which Google uses as one of many page experience signals. Strong content and relevance still matter more, so treat INP as a way to improve usability rather than a shortcut to rankings.
Why is my INP worse on mobile?
Phones have slower processors, so the same JavaScript takes longer to run. Visitors may also be on weaker networks while scripts are still loading, which keeps the main thread busy.
Can I check INP without much traffic?
Field data may be unavailable for low-traffic pages. In that case, reproduce interactions in Chrome DevTools with CPU throttling and watch for long tasks. Google's open-source web-vitals library can also report INP from your own visitors.
Is a caching plugin enough to fix INP?
Caching mainly speeds up server response and page delivery. INP is about what happens in the browser after the page loads, so you will usually need to address JavaScript, third-party scripts, and page structure as well.
Conclusion
Improving INP is less about one magic setting and more about reducing the work your page asks the browser to do at the moment a visitor interacts. Measure with real data, find the slowest interaction, remove or delay what you do not need, and test every change on a slower device. Start with plugins and third-party scripts, because those usually give the biggest gains with the least risk.
Make one change at a time, keep notes, and give field data a few weeks to update. A site that responds quickly feels trustworthy, and that is a benefit your readers will notice whether or not a score changes.
You tap a menu button on a WordPress site and nothing happens for a moment. You tap again. Then the menu opens, closes, and opens once more. Nothing is technically broken, yet the page feels unreliable. That small delay is exactly what Google's Interaction to Next Paint metric, usually shortened to INP, is designed to capture.
INP became an official Core Web Vitals metric in March 2024, replacing First Input Delay. Older speed metrics mostly describe how quickly a page first appears. INP asks a different question: when a visitor clicks, taps, or presses a key, how long does the page take to visibly respond?
This guide explains INP in plain language, shows you how to measure it properly, and walks through fixes that suit typical WordPress sites, including those that use page builders, ad scripts, and plenty of plugins. We cannot promise any ranking change, because speed is only one of many signals. What you can expect is a page that feels more responsive to real people, which is the reason the metric exists.
What Is INP and Why It Matters
Interaction to Next Paint measures how quickly a page responds to user input throughout a visit. Every click, tap, or key press is observed. The page's INP is based on one of the slowest interactions, so a single sluggish button can drag the score down even if everything else feels fast.
Responsiveness matters because visitors judge a site by how it feels, not by a number. A search box that lags, an accordion that stutters, or a "Add comment" button that seems dead all create friction. For a content site, that friction can mean readers leave sooner and engage less.
The Three Parts of an Interaction
Knowing where the time goes tells you which fix to try first.
- Input delay: the wait before the browser can start handling your click, usually because the main thread is busy running other JavaScript.
- Processing time: the time your event handlers take to run, for example a script that opens a menu or filters a list.
- Presentation delay: the time the browser needs to recalculate layout, repaint, and show the result on screen. A large, complicated page makes this slower.
INP Score Thresholds
Google publishes three ranges for INP. The result is evaluated at the 75th percentile of real page visits, meaning at least three out of four visits should fall within the range you are aiming for.
| Rating | INP value | What it means |
|---|---|---|
| Good | 200 ms or less | Interactions feel immediate for most visitors. |
| Needs improvement | Over 200 ms up to 500 ms | Noticeable lag on some interactions. |
| Poor | Over 500 ms | Visitors are likely to feel the page is slow to respond. |
INP vs FID: First Input Delay only measured the delay before the first interaction began processing. INP looks at interactions across the whole visit and includes processing and painting, so it is a stricter and more realistic test.
How to Measure INP on Your WordPress Site
The most common mistake is trusting a single lab score. INP is fundamentally a field metric: it depends on what real visitors do on real devices. Start with real data, then reproduce problems yourself.
Start With Field Data
Open PageSpeed Insights and test a few important URLs, such as your homepage, a popular post, and a page with ads or forms. If your site has enough traffic, the "Discover what your real users are experiencing" section shows INP from real Chrome users. The Core Web Vitals report in Google Search Console groups URLs with similar problems, which saves time on larger sites.
Low-traffic sites may show no field data at all. That does not mean everything is fine. It means you will rely more on your own testing.
Reproduce the Problem in Chrome DevTools
- Open the slow page in Chrome and press F12 to open DevTools.
- Go to the Performance tab and enable CPU throttling (for example 4x slowdown) to imitate a mid-range phone.
- Click Record, perform the interaction you suspect (open the menu, use the search box), then stop recording.
- Look at the Interactions track and at long tasks, which are marked with a red corner. Any task longer than 50 milliseconds can delay a response.
- Click the task and check which script, plugin file, or function is responsible.
Use Lab Metrics as Clues
Total Blocking Time (TBT) in lab tests is not INP, but it points in the same direction. A high TBT usually means long JavaScript tasks, which is a useful hint when you have no field data. Treat it as a clue rather than a verdict.
Common Causes of Poor INP on WordPress
WordPress itself is rarely the problem. The slowdown usually comes from what is layered on top of it.
| Cause | Typical symptom | Where to look first |
|---|---|---|
| Too many plugins loading scripts on every page | Menu or buttons respond late | Plugin list, Network tab |
| Third-party scripts (ads, chat, tracking, widgets) | Lag while the page is still loading | Tag manager, ad code, embeds |
| Heavy page builder output | Slow to paint after a click | Page DOM size, nested sections |
| Large JavaScript bundles | Long tasks in the performance trace | Theme and plugin script files |
| Expensive custom event handlers | One specific button is slow | Your own or a plugin's JS |
| Slow phones and shared hosting load | Fine on desktop, poor on mobile | Test with CPU throttling |
Step-by-Step: How to Improve INP in WordPress
Work through these steps in order and retest after each major change. Always make a full backup first, and try changes on a staging copy when possible.
Step 1: Record a Baseline and Find the Worst Interaction
Write down your current INP from PageSpeed Insights or Search Console, plus the exact interaction that feels slowest. Without a baseline you cannot tell whether a change helped or whether you simply got a lucky test run.
Step 2: Audit Plugins and Remove What You Do Not Need
Deactivate plugins one at a time on a staging site and repeat your slow interaction. A free tool such as Query Monitor can show which plugins add scripts and styles. Be especially careful with sliders, pop-up builders, social feeds, and all-in-one "feature" plugins that load code everywhere even when a page uses none of it. Replacing a heavy plugin with a lighter one, or with a few lines of theme code, often helps more than any tuning.
Step 3: Take Control of Third-Party Scripts
Third-party code runs on the same main thread as your own, so it competes with your visitor's click. List every external script on your key pages: analytics, ad code, chat widgets, embedded videos, review badges. For each one, ask whether it earns its place.
- Remove tags you no longer use from your tag manager.
- Load chat widgets or social embeds only after interaction, or only on pages where they matter.
- Replace video embeds with a click-to-load preview image.
- If you run ads, follow the ad provider's placement guidance and avoid stacking many ad units high on the page. Do not alter or block ad code in ways that break the provider's policies.
Step 4: Reduce and Defer JavaScript Carefully
Less JavaScript means fewer long tasks. Most performance and caching plugins offer options to defer scripts, minify files, or delay execution until the first interaction. These can help, but they can also break menus, forms, and checkout flows. Enable one option at a time, then test your key interactions on desktop and mobile after each change.
Be careful with "delay all JavaScript": It can make the first load look faster while pushing the work to the first tap, which may make that first interaction slower. Test the actual interaction, not only the loading score.
Step 5: Simplify the Page Structure
A large DOM makes every style recalculation and repaint more expensive, which increases presentation delay. Page builders can generate many nested wrappers. Look for sections with unnecessary columns, hidden mobile-only duplicates, and long pages with hundreds of repeated cards. Splitting very long pages, using simpler layouts, or paginating archives can reduce the work the browser performs after each click.
For long article pages or lists that sit far below the fold, the CSS property content-visibility: auto lets the browser skip rendering work until those sections approach the screen. It suits independent blocks, so test it before rolling it out widely.
Step 6: Break Up Long Tasks in Custom Code
If you or a developer maintain custom JavaScript, split heavy work into smaller chunks and give the browser a chance to respond to input between them. A common pattern is to yield back to the main thread:
function yieldToMain() {
  if ('scheduler' in window && 'yield' in scheduler) {
    return scheduler.yield();
  }
  return new Promise(resolve => setTimeout(resolve, 0));
}
async function processItems(items) {
  for (const item of items) {
    handleItem(item);       // your own work
    await yieldToMain();    // let the browser handle input
  }
}
The fallback uses setTimeout for browsers without scheduler.yield(). For very long lists you can yield every few items instead of every item, which keeps overhead low.
Step 7: Give Instant Visual Feedback
INP ends at the next paint. If a button triggers a slow operation, update something small first, such as a pressed state or a spinner, then do the heavy work afterward. The visitor sees an immediate response, and the browser is free to paint sooner. Doing the visual update before expensive logic is one of the simplest improvements for forms, filters, and "load more" buttons.
Step 8: Retest and Wait for Field Data
Lab tests confirm that a fix works locally. Field data in PageSpeed Insights and Search Console is collected over a rolling period, so improvements show up gradually. Do not panic if the number does not change the next day. Keep your baseline notes and compare after a few weeks of normal traffic.
Pros and Cons of Delaying JavaScript
Delaying or deferring scripts is popular advice, so it deserves a balanced look.
Advantages
- Frees the main thread during initial load
- Can reduce Total Blocking Time
- Often available as a simple plugin setting
- Works well for non-essential scripts such as chat widgets
Disadvantages
- May break menus, sliders, forms, or ads
- Can push work to the first tap, hurting that interaction
- Needs testing across devices after every change
- Hides problems rather than removing heavy code
Common Mistakes and How to Avoid Them
- Chasing a perfect lab score. A green lab score does not guarantee good field INP. Check real-user data.
- Testing only on a fast laptop. Use CPU throttling or a real mid-range phone.
- Installing several optimization plugins at once. They can conflict, and you will not know which one helped or broke something.
- Ignoring one slow button. INP reflects slow interactions, so a single heavy handler can set your score.
- Skipping backups and staging. Script changes can break layouts or ads in ways that are easy to miss.
- Removing ad or analytics code carelessly. Keep revenue and tracking intact, and change one thing at a time.
Quick Checklist
- Record current INP and the slowest interaction.
- Test with CPU throttling in Chrome DevTools.
- Remove or replace heavy plugins.
- Trim or delay non-essential third-party scripts.
- Defer scripts one option at a time, testing after each.
- Reduce DOM size and heavy page-builder layouts.
- Break up long tasks in custom code.
- Show instant visual feedback before slow work.
- Recheck field data after a few weeks.
If your theme is part of the problem, consider moving to a lightweight WordPress theme. Server resources matter too, so it is worth reviewing your hosting plan if slowness appears even on simple pages. And because images often dominate page weight, remember to optimize your images alongside the script fixes described above.
For deeper technical background, Google's own documentation on Interaction to Next Paint and how to optimize INP is a reliable reference.
Frequently Asked Questions
What is a good INP score?
Google considers 200 milliseconds or less good, 200 to 500 milliseconds as needing improvement, and over 500 milliseconds as poor, measured at the 75th percentile of real visits.
Does INP affect SEO?
INP is part of Core Web Vitals, which Google uses as one of many page experience signals. Strong content and relevance still matter more, so treat INP as a way to improve usability rather than a shortcut to rankings.
Why is my INP worse on mobile?
Phones have slower processors, so the same JavaScript takes longer to run. Visitors may also be on weaker networks while scripts are still loading, which keeps the main thread busy.
Can I check INP without much traffic?
Field data may be unavailable for low-traffic pages. In that case, reproduce interactions in Chrome DevTools with CPU throttling and watch for long tasks. Google's open-source web-vitals library can also report INP from your own visitors.
Is a caching plugin enough to fix INP?
Caching mainly speeds up server response and page delivery. INP is about what happens in the browser after the page loads, so you will usually need to address JavaScript, third-party scripts, and page structure as well.
Conclusion
Improving INP is less about one magic setting and more about reducing the work your page asks the browser to do at the moment a visitor interacts. Measure with real data, find the slowest interaction, remove or delay what you do not need, and test every change on a slower device. Start with plugins and third-party scripts, because those usually give the biggest gains with the least risk.
Make one change at a time, keep notes, and give field data a few weeks to update. A site that responds quickly feels trustworthy, and that is a benefit your readers will notice whether or not a score changes.


