Google Search Console Performance Report Explained: Clicks, Impressions, CTR and Position
What each number in the Performance report really measures, why the totals often don’t add up, and five practical ways to turn the report into better titles, smarter updates and new posts.
If you’ve added your site to Google Search Console, the Performance report is where most of the useful information lives. It shows which searches bring people to your site, which pages they land on, and how often Google shows your pages without anyone clicking.
It is also easy to misread. “Average position” isn’t your ranking, an impression doesn’t always mean someone saw your link, and the rows in the Queries table rarely add up to the totals above them. This guide explains each number in plain English, using Google’s own definitions, and then shows five practical ways to use the report to decide what to fix and what to write next. If you haven’t set up Search Console yet, start with our guide to adding your WordPress site to Google Search Console.
Key takeaways
- Clicks are the most dependable number: each one is a click from a Google result through to your site.
- Impressions, CTR and average position blend very different searches. Read them as trends, not as a ranking.
- The Queries and Pages tables rarely add up to the chart, because of hidden queries, a 1,000-row limit and two ways of counting.
- A logging error affected impressions (not clicks) from May 2025 to April 2026, so compare year over year using clicks.
Where to find the Search Console Performance report
In Search Console, open Performance in the left-hand menu. Every site has a Search results report. Sites that appear in Google Discover or Google News get separate Discover and Google News reports as well; the News report covers news.google.com and the Google News app, not the News tab in Google Search.
By default the report shows clicks and impressions for the past three months. Click the Average CTR and Average position boxes above the chart to add those lines. Keep two timing details in mind:
- New data usually appears within two to three days, and a newly added site can take up to a week. Preliminary data, when shown, is drawn as a dotted line.
- Search Console keeps the last 16 months of data. If you want a longer history, export it regularly.
The four numbers in plain English
Google defines each metric precisely in its help article What are impressions, position, and clicks? Here is what those definitions mean in practice.
- Clicks
- A click that takes someone from Google Search, Discover or News to your site. Clicking the same result again counts once, and switching to the Images tab counts nothing.
- Impressions
- How often a link to your site appeared in results someone saw. On an ordinary results page it counts even if the person never scrolled down to it; in carousels and infinite scroll it usually has to come into view.
- CTR (click-through rate)
- Clicks divided by impressions, shown as a percentage. 50 clicks from 1,000 impressions is a CTR of 5%.
- Average position
- For each search, Google takes the highest position your site reached and averages those positions across all impressions. Every link inside an AI Overview or a carousel shares one position.
Google’s own example makes average position clearer. Suppose one search shows your site at positions 2, 4 and 6, and another search shows it at 3, 5 and 9. Only the topmost result counts for each search, so the average position is (2 + 3) ÷ 2 = 2.5. That single number hides six different listings, which is why it is best read as a trend over time.

Dimensions, filters and comparisons
Below the chart, tabs let you break the same data down by Queries, Pages, Countries, Devices, Search appearance and Dates. Above the chart you’ll find the filters:
- Search type. Web results are split into Web: text-based and Web: multimodal (searches that start from an image, such as Google Lens), plus Image, Video and News. Each type is counted separately.
- Date range, with daily, weekly and monthly views, and a 24-hour view for the most recent data.
- Query, page, country, device and search appearance filters. Query and page filters accept regular expressions, which Google documents as RE2 syntax, matching part of the text and ignoring upper and lower case.
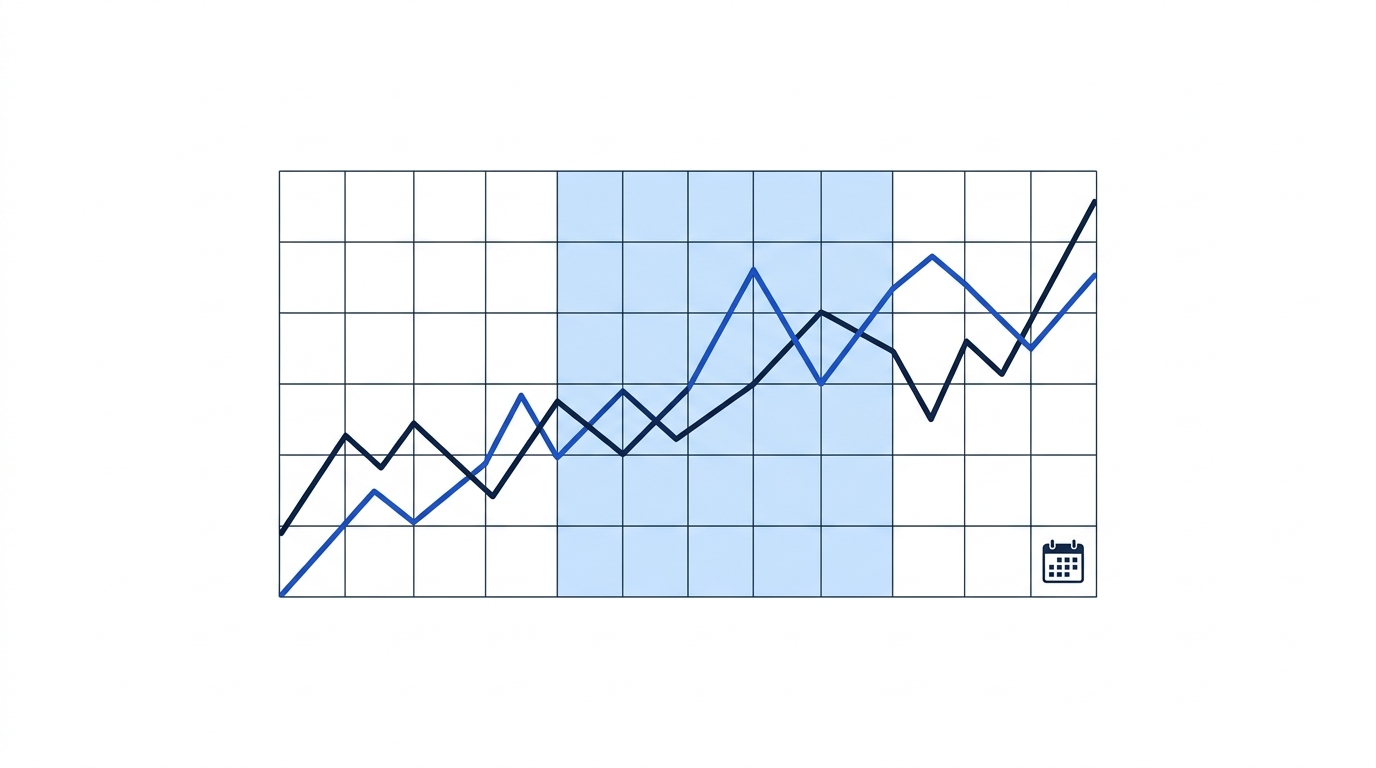
- Compare mode, which puts two date ranges, two devices, two countries or two search types side by side. Only one comparison can be active at a time.
| Question | Where to look | What to switch on |
|---|---|---|
| Which posts bring the most visitors? | Pages tab | Sort by clicks |
| Which searches show me but rarely get a click? | Queries tab | Add CTR, sort by impressions |
| Do phones and computers behave differently? | Devices tab | All four metrics |
| Did a page lose traffic? | Date range → Compare | Filter by that page |
Why the numbers don’t add up
Sooner or later everyone adds up the rows of the Queries table and finds they don’t match the total clicks above the chart. That is expected, for three reasons Google explains in its help pages:
- Hidden queries. To protect privacy, very rare searches are anonymized. They are included in the chart totals but left out of the table. In its own large analysis, Ahrefs found that close to half of clicks came from searches that Search Console doesn’t list.
- A 1,000-row limit. The table, and exports from it, stop at 1,000 rows. Larger sites need the Search Console API or the bulk export to BigQuery, which starts collecting from the day you set it up and doesn’t fill in older data.
- Two ways of counting. Queries, countries, devices and dates are counted per site, while pages and search appearance are counted per page. When several of your pages appear in the same search, the page view counts each of them, so page totals can be higher than site totals.
Five practical ways to use the report
-
Rewrite titles on pages that are seen but not clicked
Google’s own advice is to look for high-impression, low-CTR pages and review their titles and snippets. Open the Pages tab, switch on CTR, sort by impressions and compare each page with similar pages on your own site. Our guide to title tag and meta description length shows how to write a better snippet. Google also cautions against expecting to capture every click for a search, because many things decide which result a searcher chooses.
-
Improve pages that are close to page one
Queries with an average position of roughly 8 to 20 are often called “striking distance”. That range is an SEO community rule of thumb rather than Google guidance, but it is a useful shortlist. Check that the page fully answers the search, add the missing section, and link to it from related posts. Our explainer on search intent helps you see what the searcher actually wants.
-
Find pages that compete for the same search
Click a query, then open the Pages tab. If two or more of your posts share the impressions for one search, they may be splitting your chances. Merge them, or make each one clearly about something different. Our guides to keyword cannibalization and 301 redirects explain how.
-
Diagnose a traffic drop
Google’s guide to traffic drops suggests setting the date range to the last 16 months, comparing the last three months year over year, and clicking through every tab to see whether the drop is limited to some pages, queries, countries or devices. It also notes that small changes in position can happen at any time. If one older post has slipped, our guide to updating old blog posts walks through a refresh.
-
Find ideas for new posts
Look for queries that show your site but don’t match any page you have written. Questions are a good place to start. In the Queries tab, add a filter, choose Custom (regex) and paste a pattern like the one below to list only searches that begin with a question word. Turn the best ones into a plan with our content brief template.
^(how|what|why|when|which|who|can|does|is|are|should)\bNewer features worth knowing
Search Console has added several features since 2024. Not every site sees all of them, but they are worth checking for:
- Branded and non-branded queries. A filter that separates searches containing your brand name from everything else. It became available to all eligible sites in March 2026, according to Search Engine Land; it isn’t offered for small sites or sub-properties, and Google notes that its automatic labelling can be wrong.
- Custom annotations. Short notes pinned to a date on the chart, such as “rewrote title” or “moved to HTTPS”. Each note can be up to 120 characters, a property can hold 200, and notes disappear after 500 days. They are ideal for measuring the effect of your changes.
- Generative AI performance. A separate report that shows impressions in AI Overviews and AI Mode. It shows impressions only; clicks from AI features are counted in the main report under Web search.
Read 2025–2026 data with care
Two events changed the numbers in a way that has nothing to do with your content, so keep them in mind when you compare periods.
Separately, in September 2025 Google stopped supporting a search parameter that rank-tracking tools used to load 100 results on one page. In an analysis of 319 sites by Tyler Gargula of LOCOMOTIVE Agency, reported by Search Engine Land, 87.7% recorded fewer impressions afterwards. If your impressions dropped that month while clicks held steady, this change is a likely explanation.
Common misreadings
On that last point: Backlinko’s analysis of 4 million search results, first published in 2019 and last updated in April 2025, put the average CTR of the top result at 27.6%. First Page Sage’s September 2026 report put the first result at 7.1% overall, or 22.6% on results pages without an AI answer. Pew Research Center found that people clicked a traditional result on 8% of visits when an AI summary appeared, against 15% without one. Different data, methods and search features produce different answers, so the most useful benchmark is your own site: compare a page with your similar pages and with its own past.
Finally, don’t expect Search Console to match Google Analytics. They measure different things, and Google states that “the source of truth for Search performance will always be Search Console”; the two should agree only on general trends.
Frequently asked questions
Why does Search Console show impressions but no clicks?
Your page appeared in results, but nobody chose it. That is normal for pages ranking low on the page and for searches answered directly in the results. If a page gets many impressions over weeks and almost no clicks, review its title and description; Google notes that a low CTR can mean people don’t think your page answers their search.
What is a good CTR?
There is no single good number. CTR depends on position, the type of search and what else appears on the results page. Compare a page with similar pages on your site and with its own history instead of with published averages.
How far back can I see my data?
Sixteen months. For a longer history, export the data regularly or connect the bulk export, which collects data from the day you switch it on.
Does the report include clicks from AI Overviews?
Yes. Clicks from AI features are counted in the main Search results report under the Web search type. The separate generative AI report shows impressions only.
Why are some of my queries missing?
Rare searches are anonymized to protect users’ privacy, and the table shows a maximum of 1,000 rows. Both are normal and don’t mean your data is wrong.
Conclusion
The Search Console Performance report rewards a calm, regular look rather than daily checking. Trust clicks first, read impressions and position as trends, and remember why the Queries table and the chart rarely match. Used that way, the report tells you exactly which titles to rewrite, which posts to improve and which questions deserve their own article.
Open the Pages tab, switch on CTR, sort by impressions and pick the first page with a CTR well below your other posts. Rewrite its title and description, add a custom annotation with today’s date, and check the effect in four weeks.
Sources
- Performance report (Search results): Overview and basic setup, Search Console Help
- What are impressions, position, and clicks?, Search Console Help
- Data anomalies in Search Console, Search Console Help
- Debugging drops in Google Search traffic, Google Search Central
- Using Search Console and Google Analytics data for SEO, Google Search Central